
Gold and Silver at a Critical Crossroad: Correction, Consolidation or the Next Major Move?
19-07-2026
Gold and silver are entering an important phase after the extraordinary volatility witnessed during the first half of 2026. The larger structural trend in precious metals remains significant, but the weekly charts indicate that short-term momentum has weakened. Both metals are now trading near decisive technical zones that may determine whether the next move is a bullish recovery or a deeper corrective phase.
Gold continues to receive long-term support from geopolitical uncertainty, central-bank accumulation and investment demand. However, investor sentiment has recently become more cautious. Global gold-backed ETFs recorded outflows of US$8.9 billion in June, although flows for the first half of 2026 remained positive. Asian demand and continued purchases by the People’s Bank of China have provided some underlying support
Silver’s fundamental picture remains relatively supportive over the longer term. The global silver market is expected to record its sixth consecutive annual deficit in 2026. Nevertheless, weaker industrial fabrication and ongoing silver-thrifting in the photovoltaic industry could limit near-term demand growth.

19-07-2026
Gold Technical Outlook: Wave-4 Support Under Examination
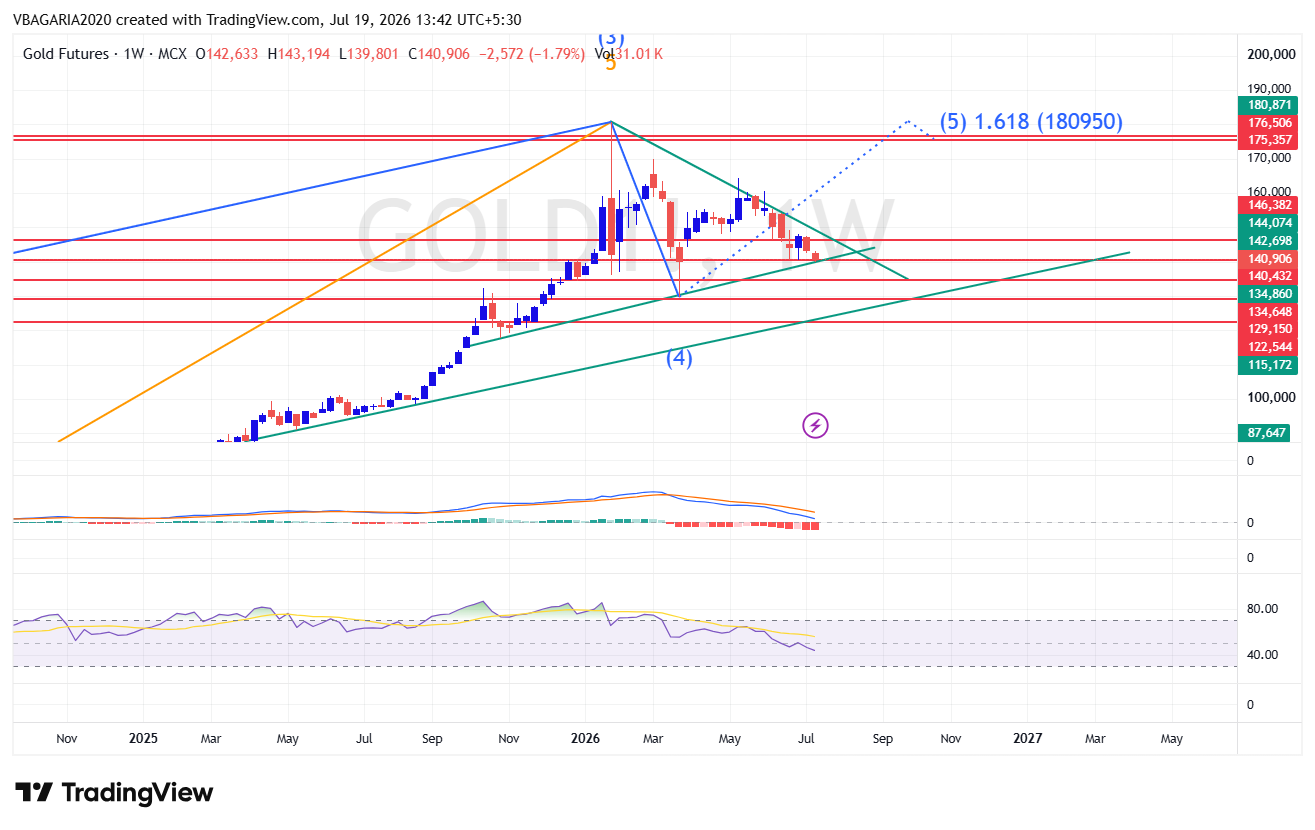
MCX Gold closed the week around 140,906, after trading between 139,801 and 143,194. The weekly chart shows that prices are consolidating inside a broad corrective formation after the sharp rally and subsequent rejection from the January peak.
From an Elliott Wave perspective, the decline toward the 134,648–134,860 region can be interpreted as a possible Wave-4 correction. Gold subsequently recovered, but the rebound has so far failed to produce a decisive breakout above the descending resistance line. This means that the proposed Wave-5 advance remains a possibility, but it is not yet technically confirmed.
Momentum indicators are also demanding caution. The weekly MACD remains in a bearish configuration, with negative histogram bars indicating continued downward pressure. The RSI has slipped below its equilibrium region, suggesting that buyers have not yet regained control.
Bullish Scenario
Gold must first sustain above 143,698–144,574 and then record a convincing weekly breakout above 145,382. Such a move would break the immediate corrective structure and improve the probability that Wave 5 has begun.
If the breakout is supported by improving momentum, gold could initially move toward the previous supply region. Over the larger positional horizon, the Elliott Wave 1.618 extension shown on the chart is placed near 180,950. This should be treated as a long-term technical projection rather than an immediate target.
Bearish Scenario
A weekly close below 139,500 would keep the corrective pressure intact and could expose the important 135,000–132,000 demand zone.
Gold Strategy
The preferred approach is to avoid chasing prices during the current consolidation. Positional investors may monitor bullish reversal confirmation around the established support zones, while momentum traders should wait for a sustained breakout above 146,382.
Until that breakout occurs, gold should be considered structurally positive over the longer term but corrective and conditionally bullish in the short term.
19-07-2026
Silver Technical Outlook: Major Trendline Becomes the Deciding Factor
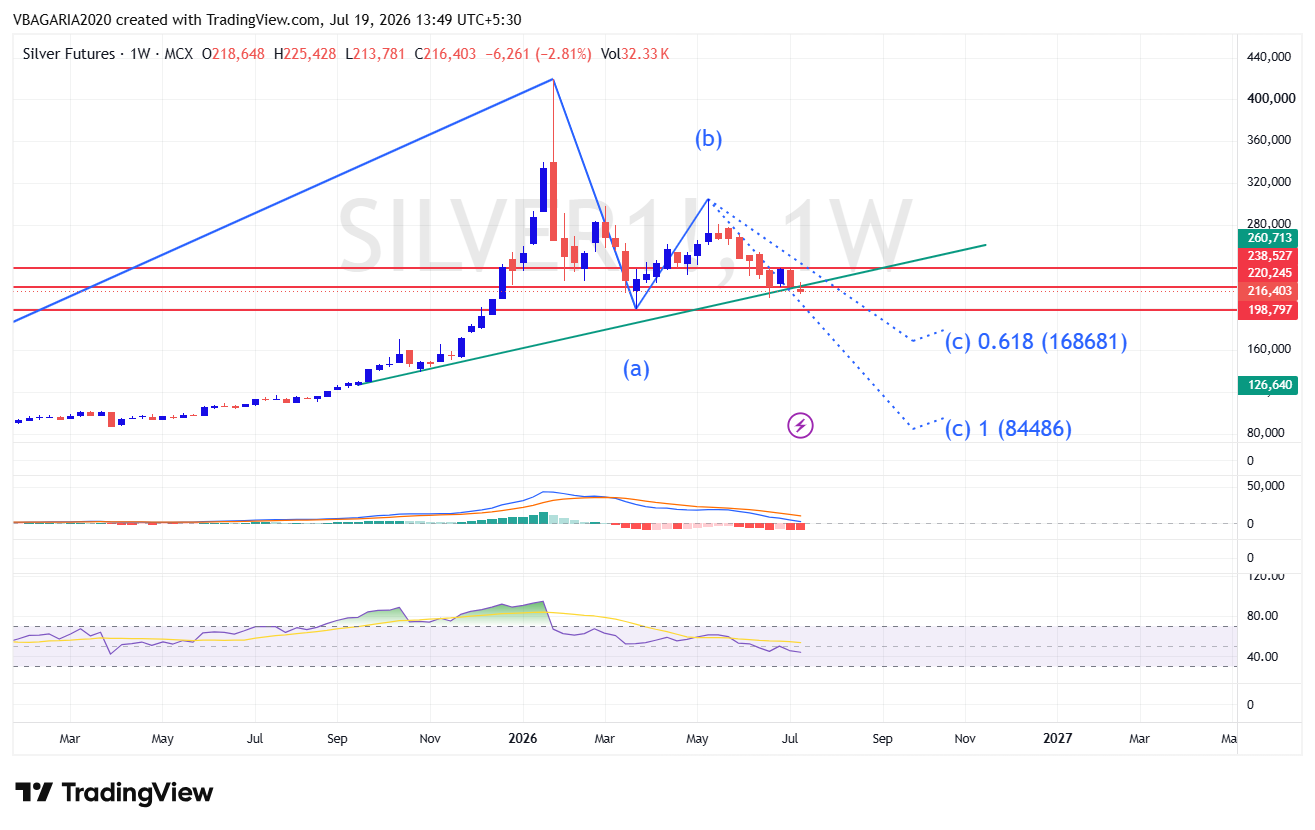
MCX Silver closed around 216,403, declining approximately 2.81% during the week. Price is now testing a critical combination of horizontal support and the long-term rising trendline.
The chart indicates a possible A-B-C corrective structure. Wave B appears to have terminated near the May recovery high, after which silver began forming lower highs and lower lows. The current weakness has brought the market close to the rising structural support that has guided the larger advance.
The weekly MACD has turned bearish, while the negative histogram continues to expand. RSI has also moved below the neutral region. These signals indicate weak momentum and suggest that a sustainable recovery requires clear price confirmation
Bullish Scenario
Silver must reclaim 220,500 and sustain above the rising trendline to reduce the immediate breakdown risk. A stronger reversal would require a weekly close above 238,000.
A successful breakout above 238,000 could open the way toward 260,713. Moving above that level would indicate that the corrective phase is losing strength and the broader bullish structure is attempting to reassert itself.
Bearish Scenario
A decisive weekly close below 198,797, accompanied by a breakdown of the long-term trendline, would confirm further structural weakness. Silver currently carries greater downside volatility than gold. Fresh positional buying should therefore wait for either:
- A clear bullish reversal from the 200,000 support region, or
- A sustained recovery above 225,500, followed by a breakout above 238,527.
Traders should avoid aggressive averaging if silver closes below 200,000
19-07-2026
Vikash Bagaria
SEBI Registered Research Analyst – INH300008155
BSE Enlistment No. 5426 | www.chartntrade.com
“Investments in Securities market are subject to Market Risks, Read all the related documents carefully before Investing.”
"Registration granted by SEBI & Certification from NISM in no way guarantee performance of the intermediary or provide any assurance of returns to Investors."
“The securities quoted are for illustration only and are not recommendatory.”
Read all the Risk & Research Disclosure here: https://chartntrade.com/research-disclaimer
Market conditions can change without notice. Viewers should evaluate their financial position, investment objectives and risk profile before acting on any market-related information.