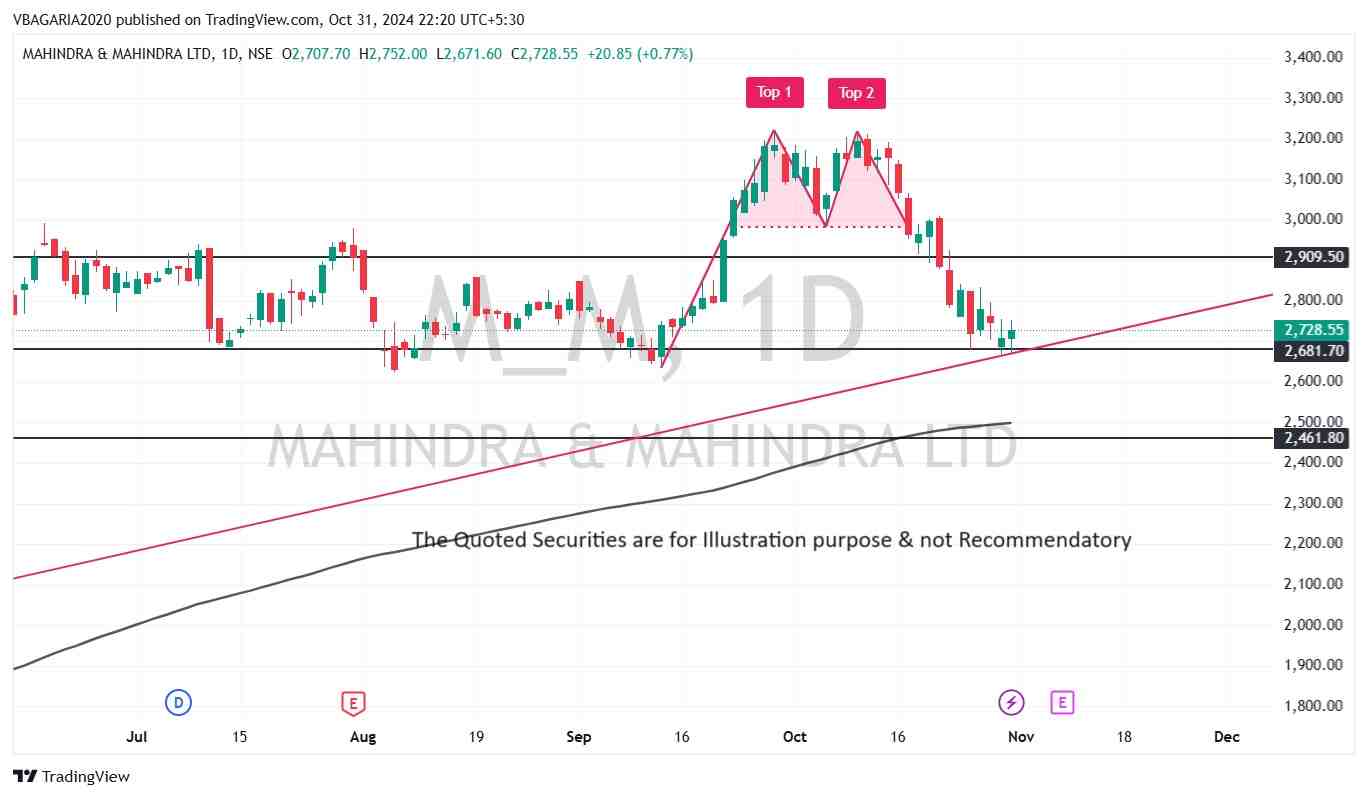
Mastering the Double Top Pattern: Spotting Reversal Signals Like a Pro!
31-10-2024

Mastering the Double Top Pattern: Spotting Reversal Signals Like a Pro!
In the dynamic world of stock market trading, patterns often tell stories about where prices might head next. One powerful chart formation that traders swear by for spotting potential reversals is the Double Top Pattern. This pattern can be a game-changer for those who want to stay ahead of trend shifts, helping you understand when an uptrend might be losing steam and signaling a potential downturn. Let’s dive into the magic of the Double Top and how you can leverage it to make smarter, more profitable trading decisions.
What is a Double Top Pattern?
The Double Top pattern is a widely recognized reversal pattern that often emerges in a bullish market. Imagine the price is soaring, optimism is high, and then—bam! The price hits a peak but struggles to push higher. It pulls back briefly, makes a second attempt, but once again fails to surpass the previous high. This “M” shape that forms on the chart is your Double Top, a tell-tale sign that buyers may be running out of steam and sellers might be gearing up to take control.
Key Features of the Double Top Pattern
Formation of Two Peaks: The Double Top is identified by two distinct peaks at approximately the same level, separated by a minor pullback (a trough). This pattern typically signals a trend reversal and the end of an upward rally.
Neckline Break Confirmation: The trough between the peaks creates a “neckline.” Once the price breaks below this support level, it acts as a confirmation of the reversal and could indicate further downside.
Volume Dynamics: Volume often plays a crucial role here. You’ll typically see high volume during the peaks and diminishing volume on the second peak. When the neckline breaks, if there’s a volume surge, it strengthens the signal for a downward trend.
Why the Double Top Matters in TradingThe Double Top pattern is a trader`s secret weapon for spotting potential tops in the market. Its predictive power comes from its ability to show a shift in sentiment, where bullish confidence is fading, and a bearish outlook may be starting to build. By recognizing the Double Top early, traders can prepare for potential sell-offs, manage their risks effectively, and capitalize on the reversal.
How to Trade the Double Top Pattern
Identify the Double Top Formation: The first step is spotting two peaks at a similar price level, with a minor pullback (or trough) in between. Patience is key, as you’ll want to ensure the pattern is fully formed.
Wait for the Neckline Break: The neckline, or support level between the peaks, is crucial. A clear break below this line signals the pattern’s completion. This is where most traders initiate a short position, anticipating further downside.
Set Target Levels and Stop-Losses: The Double Top provides a built-in price target. Measure the distance between the peaks and the neckline and project this distance downward from the neckline to set your target. Additionally, place a stop-loss above the second peak to manage risk in case of a reversal.
Real-World Example: Double Top in Action
Let’s say a stock is in a strong uptrend, rallying to Rs 100 before pulling back to Rs 90. The stock then rises again to Rs 100 but fails to break through, dropping back to Rs 90. This creates a Double Top, and if the price breaks below Rs 90 on high volume, this would indicate a bearish reversal. Here, a savvy trader might look for Bearish Entry.
Final Thoughts: Harnessing the Double Top Pattern in Your Strategy
The Double Top pattern is an invaluable tool for any trader looking to identify reversals and avoid getting caught in a downtrend. While it’s essential to confirm the pattern before making a move, spotting a Double Top can give you a strategic edge in predicting potential shifts in stock prices. Combine this pattern with solid risk management, and you’ve got a formula for smarter, more calculated trades.
Remember, in the stock market, knowledge is power—and mastering the Double Top pattern could be your ticket to more successful trades!
- #DoubleTopPattern #ChartPatterns #TrendReversal #TechnicalAnalysis #StockMarketTips #TradingPatterns #MarketReversal #StockTrading101 #PriceAction
- #TradingStrategies #StockMarket #Investing #Stocks #Trading #DayTrading #Forex #CryptoTrading #FinancialMarkets #WealthManagement #MarketAnalysis
"The securities quoted are for illustration only and are not recommendatory"
Vikash Bagaria SEBI Registered Research Analyst - INH300008155
Disclaimer: Investments in Securities Market are subject to market Risks, Read all the related documents carefully before Investing
https://chartntrade.com/research-disclaimer

